How to choose compositing tools and lightweight motion design software that eliminate render delays
Learn to evaluate editing tools for instant visual feedback on finance content. This guide covers software selection, workflow architecture, and automation strategies that cut production time.
TL;DR
Audit before optimizing - Track where time actually goes in your workflow. Most creators underestimate render waiting time and optimize the wrong bottlenecks.
Real-time playback eliminates uncertainty - Instant visual feedback lets you catch errors early, iterate faster, and publish while topics remain relevant.
Tool selection determines your ceiling - Choose software based on your specific bottlenecks, not feature lists. A focused tool that solves your problems beats a powerful tool that does not.
Data-driven animation scales efficiency - Connect data sources directly to visual outputs. Manual keyframing for each data point wastes time and introduces errors.
Verification must precede speed - Fast workflows that produce incorrect finance content are not actually fast. Build accuracy checks into your process, not as alternatives to efficiency.
Guide Orientation: What This Guide Covers
This guide examines how real-time playback in editing transforms production workflows for finance content creators. You will learn to evaluate compositing tools, identify lightweight motion design tools suited to data visualization, and implement practical techniques that reduce render wait times.
By the end, you will understand which tools deliver instant visual feedback, how to structure projects for speed, and where automation eliminates manual bottlenecks. This guide covers software selection, workflow architecture, and execution strategies.
We exclude deep tutorials on specific software interfaces. Instead, we focus on decision frameworks that apply across tools, whether you work in After Effects, DaVinci Resolve Fusion, or AI-powered alternatives like Flowi.
Why Real-Time Playback Matters for Finance Creators
Finance content operates on compressed timelines. Market data shifts hourly. Earnings reports demand same-day visualization. Waiting for renders while competitors publish erodes your relevance.
The video editing market reached USD 3.8 billion in 2024, projected to hit USD 8.5 billion by 2031. This growth stems largely from GPU acceleration and real-time editing capabilities that professionals now expect as baseline functionality.
For finance communicators specifically, the cost of slow workflows compounds. A chart animation that takes 45 minutes to preview means 45 minutes of uncertainty about whether your data displays correctly. Multiply this across a 10-chart video, and you have lost half a workday to waiting.
Real-time playback eliminates this uncertainty. You see changes instantly. You catch errors before they propagate. You iterate faster, which means you publish faster and capture audience attention while topics remain relevant.
The shift toward cloud-based real-time rendering and AI compositing has eroded traditional skills gaps. Tools that once required years of expertise now offer accessible entry points. This democratization means your competitive advantage lies not in technical mastery but in speed and accuracy of execution.
Core Concepts: Understanding the Technical Landscape
Layer-Based vs. Node-Based Compositing
Layer-based systems (After Effects, Apple Motion) stack visual elements vertically. You work top-to-bottom, adjusting properties on each layer. This approach feels intuitive for simple projects but becomes unwieldy with complex data visualizations.
Node-based compositing (Blackmagic Fusion, Nuke VFX software, Natron) connects operations as a visual flowchart. Data flows through nodes, each performing a specific transformation. This architecture scales better for procedural animation techniques where one data source drives multiple visual outputs.
Proxy Workflows vs. Native Playback
Proxy workflows substitute lower-resolution files during editing, then swap to full resolution for final render. This approach worked well before GPU acceleration matured. Today, many lightweight motion design tools deliver native playback at full resolution, eliminating the proxy step entirely.
Render-Dependent vs. Render-Free Systems
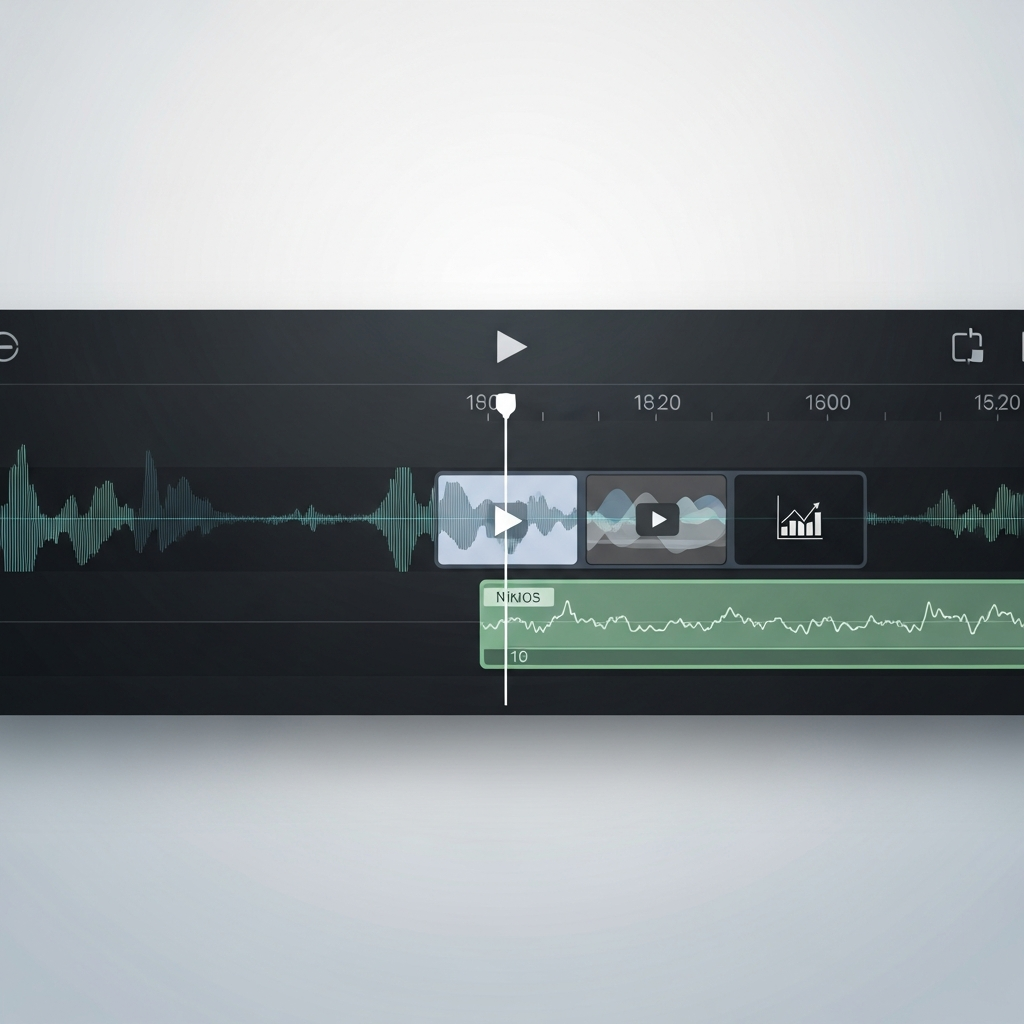
Traditional compositing tools require rendering to see final output. Render-free systems generate final-quality visuals in real time. This distinction matters enormously for finance creators who need to verify data accuracy before publication.
AI-powered tools like Flowi represent the render-free category, generating After Effects-quality charts without timeline editing or render queues. This approach prioritizes accuracy verification over technical manipulation.
The Framework: Four Stages of Production Optimization
Reducing production time requires systematic intervention at four stages: tool selection, project architecture, execution workflow, and output delivery. Each stage offers distinct optimization opportunities.
Tool selection determines your ceiling. Choosing software without real-time playback capabilities limits every subsequent decision. Project architecture establishes efficiency patterns that compound across all content. Execution workflow addresses daily habits and techniques. Output delivery optimizes the final mile from finished project to published content.
These stages interconnect. A well-architected project in a poorly chosen tool still suffers. Excellent tools with chaotic project structures waste their potential. The framework succeeds when all four stages align toward the same efficiency goals.
Step 1: Audit Your Current Workflow Bottlenecks
Objective
Identify where time actually disappears in your current production process. Most creators underestimate render wait times and overestimate creative development time.
Execution Guidance
Track your next three projects with granular time logging. Separate active work (making decisions, adjusting parameters) from passive waiting (rendering, exporting, loading). Calculate the ratio.
Document which tasks require multiple render cycles to verify. These represent your highest-value optimization targets. A chart animation you render six times to perfect costs six times more than one you preview instantly.
Note handoff points where work transfers between tools or team members. Each handoff introduces delay and potential error. The real-time collaboration market is predicted to reach $4.39 billion by 2029 precisely because handoffs represent such significant friction.
Anti-Patterns to Avoid
Do not rely on memory to estimate time allocation. Perception distorts waiting time. Do not audit only successful projects. Failed or abandoned projects often reveal the most painful bottlenecks.
Success Indicators
You have completed this step when you can state with confidence: "I spend X% of production time waiting for renders, Y% on revisions due to data errors, and Z% on active creative work." These percentages guide all subsequent decisions.
Step 2: Evaluate Tools Against Your Specific Requirements
Objective
Select software that addresses your documented bottlenecks rather than chasing feature lists that sound impressive but do not serve your workflow.
Execution Guidance
Create a decision matrix with your top three bottlenecks as row headers. Evaluate each tool candidate against these specific criteria. A compositing tools comparison only matters when grounded in your actual needs.
For data visualization work, prioritize tools that handle numerical input natively. After Effects alternatives like DaVinci Resolve Fusion offer powerful compositing but still require manual keyframing for data-driven animation. Houdini for motion graphics excels at procedural systems but demands significant learning investment.
Consider the AI in video editing market growth from US$0.9 billion in 2023 to projected US$4.4 billion by 2033. This trajectory signals where tool development concentrates. Platforms investing in AI-powered features (auto-captioning, color matching, data-driven animation) will mature faster than those relying on manual workflows.
Blender for animation offers zero licensing cost with increasingly capable motion graphics tools. Apple Motion features tight integration with Final Cut Pro. Natron software provides open-source node-based compositing. Each serves different creator profiles.
Anti-Patterns to Avoid
Do not select tools based on what industry leaders use. Their scale, budgets, and team structures differ from yours. Do not prioritize feature count over workflow fit. A tool with 200 features you will never use costs more in complexity than a focused tool with 20 features you use daily.
Success Indicators
You have completed this step when you can articulate why your chosen tool addresses your specific bottlenecks better than alternatives. "I chose X because it solves my Y problem" beats "I chose X because it is popular."
Step 3: Architect Projects for Real-Time Performance
Objective
Structure projects so real-time playback remains possible throughout production, not just at the beginning when complexity is low.
Execution Guidance
Establish naming conventions that enable instant identification of element types, data sources, and version states. Consistent naming reduces cognitive load and search time.
Organize compositions or node trees by function rather than chronology. Group all chart elements together, all text elements together, all transition elements together. This structure enables selective loading and targeted previewing.
Pre-render static elements that will not change. Background textures, logo animations, and standard transitions can exist as pre-rendered assets, freeing real-time resources for dynamic data visualization.
Build template-based motion graphics systems where data inputs drive visual outputs. This approach aligns with how lightweight tools with real-time playback are reshaping the market, projected to grow from USD 635 million to USD 1380.5 million by 2034.
Anti-Patterns to Avoid
Do not nest compositions or node networks excessively. Each nesting level adds processing overhead. Do not apply effects globally when local application suffices. A blur on one element costs less than a blur on a parent composition containing 50 elements.
Success Indicators
You have completed this step when adding new data to an existing project does not degrade playback performance. Your architecture should scale with content volume, not collapse under it.
Step 4: Implement Data-Driven Animation Systems
Objective
Connect data sources directly to visual outputs, eliminating manual keyframing for each data point.
Execution Guidance
Identify which visual properties should respond to data: bar heights, line positions, pie slice angles, numerical text displays. Map each property to a data input.
For traditional tools, use expressions or scripting to link spreadsheet values to animation parameters. After Effects expressions can read JSON data. DaVinci Resolve Fusion nodes can accept external inputs.
For AI-powered approaches, tools like Flowi automate this connection entirely. You provide data, the system generates accurate visualizations without manual property linking. This approach suits creators who prioritize insight communication over technical animation control.
The shift matters because 51% of marketers now use AI tools for video creation and editing. Data-driven animation tools represent the practical application of this trend for finance content specifically.
Anti-Patterns to Avoid
Do not manually keyframe data that could be automated. Every manual keyframe is a potential error and a time cost. Do not ignore data validation. Automated systems amplify errors as readily as they amplify efficiency.
Success Indicators
You have completed this step when updating source data automatically updates all dependent visualizations. Change a number in your spreadsheet, see the change reflected in your animation without additional work.
Step 5: Optimize Preview and Render Settings
Objective
Configure software settings to maximize real-time playback quality without sacrificing final output standards.
Execution Guidance
Allocate GPU resources appropriately. Modern visual effects software benefits dramatically from GPU acceleration. Ensure your system prioritizes the application during preview sessions.
Set preview resolution to match your monitoring setup, not your delivery specification. If you edit on a 1080p monitor, previewing at 4K wastes resources. Reserve full resolution for final export.
Configure RAM preview settings to cache frequently-accessed segments. Identify which portions of your timeline you review repeatedly and ensure they remain cached.
For cloud-based workflows, cloud subscriptions are expanding at 8.23% annually, enabled by sub-second proxy streaming. Consider whether cloud rendering for final output frees local resources for real-time preview work.
Anti-Patterns to Avoid
Do not enable effects during preview that you can evaluate separately. Motion blur, depth of field, and film grain can be toggled off during composition work and enabled only for final review. Do not preview with audio processing if audio is not your current focus.
Success Indicators
You have completed this step when your preview framerate matches or exceeds your delivery framerate for typical project complexity. Dropped frames during preview indicate further optimization opportunities.
Step 6: Establish Quality Verification Checkpoints
Objective
Catch errors early through structured review points rather than discovering problems after full renders.
Execution Guidance
Define verification checkpoints at natural project milestones: after data import, after initial layout, after animation timing, after color and style application. Each checkpoint should have specific criteria.
For finance content, data accuracy verification must precede any other review. A beautifully animated chart with incorrect numbers damages credibility more than a rough animation with correct numbers. Verify data first, always.
Use real-time playback specifically for motion timing verification. Static screenshots cannot reveal animation pacing problems. Watch animations play at intended speed before proceeding.
Document common errors from past projects. Create checklists specific to your content type. A checkpoint system that catches your actual mistakes outperforms a generic quality assurance process.
Anti-Patterns to Avoid
Do not skip checkpoints under deadline pressure. Errors discovered late cost more time than checkpoints consume. Do not verify only what is easy to check. Difficult verifications often catch the most consequential errors.
Success Indicators
You have completed this step when errors are consistently caught at early checkpoints rather than discovered in final review or, worse, after publication.
Step 7: Streamline Output and Distribution
Objective
Minimize time between finished project and published content through optimized export workflows.
Execution Guidance
Create export presets for each distribution channel. YouTube, LinkedIn, Twitter, and internal presentations each have optimal specifications. Preset configurations eliminate per-export decision making.
Batch export when possible. If your tool supports queue-based rendering, stack multiple outputs and process them during off-hours. Your creative time should not overlap with render time.
Consider direct-to-platform publishing where available. Some tools integrate with distribution platforms, eliminating manual upload steps. Each eliminated step reduces total production time.
For high-volume creators, evaluate whether cloud rendering services reduce total time-to-publish even if individual renders take longer. Freeing local resources for the next project can outweigh faster local renders.
Anti-Patterns to Avoid
Do not re-export entire projects for minor corrections. Structure projects so individual segments can be exported and replaced. Do not maintain separate projects for different platforms when aspect ratio adjustments suffice.
Success Indicators
You have completed this step when time from "project complete" to "content live" is measured in minutes, not hours. Export and distribution should feel like a button press, not a process.
Practical Application: Workflow Comparison
Traditional Workflow
A finance creator receives quarterly earnings data. They manually enter numbers into After Effects, keyframe each bar in a chart animation, render to preview, notice an error, correct, re-render, adjust timing, re-render again. Total time: 3-4 hours for a 30-second chart animation.
Optimized Workflow
The same creator imports data into a template-based system with real-time playback. They verify data accuracy instantly, adjust timing while watching playback, confirm the result, and export. Total time: 30-45 minutes for the same output.
AI-Automated Workflow
Using a tool like Flowi, the creator provides data and selects a visualization style. The system generates accurate, animated charts automatically. The creator reviews, requests adjustments through natural language, and exports. Total time: 10-15 minutes.
The difference compounds across projects. A creator producing 20 visualizations monthly saves 50+ hours by moving from traditional to optimized workflows, and 70+ hours by adopting AI-automated approaches.
Common Mistakes and Pitfalls
Creators often optimize the wrong stage. They invest in faster export codecs while ignoring preview bottlenecks that consume far more cumulative time. Audit first, optimize second.
Tool switching without workflow adjustment wastes potential. A new tool with old habits delivers marginal improvement. Commit to learning new approaches, not just new interfaces.
Perfectionism during preview defeats the purpose of real-time feedback. Use instant playback to make quick decisions, not to endlessly refine details that audiences will not notice. Save perfectionism for elements that matter.
Ignoring data validation in pursuit of speed creates costly corrections. A fast workflow that produces incorrect content is not actually fast. Build verification into your speed, not as an alternative to it.
What to Do Next
Start with the audit. Track your next project with honest time logging. The numbers will surprise you and will guide every subsequent decision with actual data rather than assumptions.
If your audit reveals render waiting as a primary bottleneck, evaluate one tool with genuine real-time playback capabilities. Test it on a low-stakes project before committing to workflow migration.
If data entry and accuracy verification consume significant time, explore data-driven animation tools that connect directly to your data sources. The automation investment pays returns on every future project.
Return to this guide as your workflow evolves. Different stages become relevant as you address current bottlenecks and discover new ones. Optimization is iterative, not final.
Frequently Asked Questions
What are some alternatives to After Effects for data visualization?
DaVinci Resolve Fusion offers node-based compositing with strong color grading integration. Blender provides free, capable motion graphics tools with a steeper learning curve. Apple Motion delivers tight Final Cut Pro integration at lower cost. For finance-specific work, AI-powered tools like Flowi automate chart and graph animation without requiring timeline editing skills.
Why should I consider node-based compositing over layer-based systems?
Node-based systems scale better for complex projects. When one data source drives multiple visual outputs, nodes let you branch and merge data flows visually. Layer-based systems require duplicating effects across layers, increasing maintenance burden. For data-heavy finance content, node-based approaches often prove more efficient once you overcome the initial learning curve.
How does Blackmagic Fusion compare to After Effects?
Fusion uses node-based compositing while After Effects uses layers. Fusion is included free with DaVinci Resolve, making it accessible for budget-conscious creators. After Effects has a larger plugin ecosystem and more tutorial resources. For pure compositing work, Fusion is highly capable. For motion graphics with extensive template libraries, After Effects retains advantages.
Which tools are best for beginners transitioning from After Effects?
Apple Motion offers familiar layer-based concepts with simpler pricing. DaVinci Resolve Fusion provides free access to professional-grade tools with excellent documentation. For creators focused specifically on data visualization rather than general motion graphics, AI-powered tools like Flowi eliminate the technical learning curve entirely by automating animation generation.
What are the advantages of using Blender for motion graphics?
Blender costs nothing, receives regular updates, and combines 3D modeling, animation, and compositing in one application. Its motion graphics capabilities have matured significantly, with geometry nodes enabling procedural animation techniques. The tradeoff is a steeper learning curve and interface conventions that differ from traditional video tools.
How do I maintain data accuracy when automating chart animations?
Establish verification checkpoints before any creative work begins. Import data, generate initial visualization, and verify numbers match source data exactly. Build validation into your templates where possible, such as sum checks for pie charts or range validation for bar charts. Never assume automation means accuracy. Verify every time.
Sources
https://www.6wresearch.com/market-takeaways-view/how-big-is-the-video-editing-market
https://www.mordorintelligence.com/industry-reports/video-editing-market
https://www.marketreportsworld.com/market-reports/video-editing-software-market-14722049
https://blog.hubspot.com/marketing/video-marketing-statistics
Read Next
