How real-time engagement metrics outperform legacy tools for dynamic financial content
Discover why traditional analytics fall short for finance content creators using motion graphics and data visualizations. Learn which approach delivers faster insights and actionable engagement data.
TL;DR
Visual analytics outperforms traditional for video and motion graphics - Real-time insights and granular engagement metrics reveal attention patterns that surface metrics miss entirely.
Traditional analytics still wins on cost and simplicity - Free tiers, easy setup, and unified cross-platform dashboards make it the practical foundation for traffic and conversion tracking.
Neither solves attribution or comprehension measurement - Both approaches struggle to connect engagement to business outcomes and cannot confirm whether audiences understood your data.
Build a layered approach for finance content - Use traditional analytics for traffic analysis, layer visual analytics for content-specific optimization on high-stakes visualizations.
Match your analytics investment to content format - If you produce animated charts and motion graphics, visual analytics justifies its cost through faster iteration cycles and clearer optimization signals.
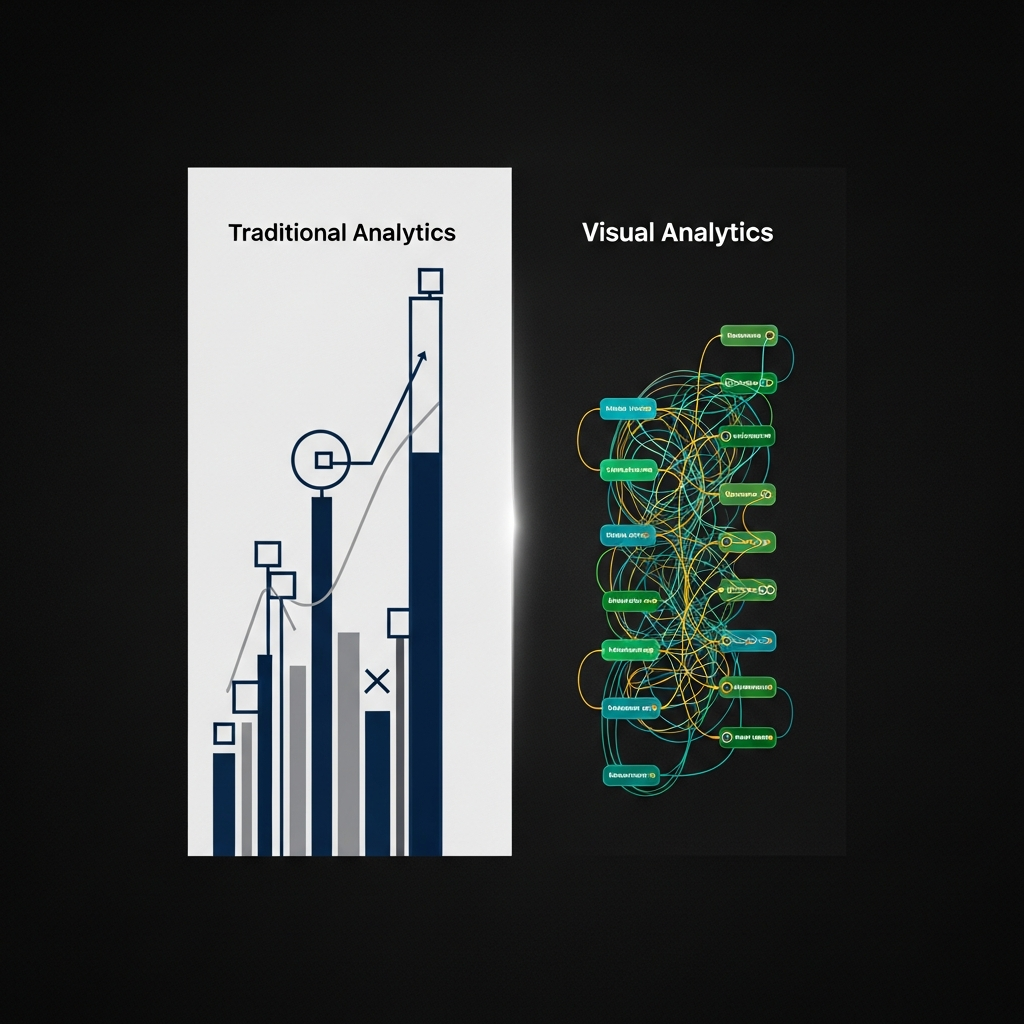
The Analytics Divide: What Finance Content Creators Actually Need
Finance content creators face a measurement paradox. You produce data-rich videos and visualizations, yet the tools measuring their impact often lag behind the content itself. Traditional analytics platforms were built for static web pages and text-based content. They struggle to capture how audiences interact with dynamic financial visualizations.
This comparison examines visual analytics versus traditional analytics approaches for finance content. We focus on three dimensions that matter most: speed of insight delivery, depth of engagement metrics, and actionability for content optimization. If you create charts, motion graphics, or data-driven videos for financial audiences, the analytics approach you choose directly affects your production workflow and content strategy.
Quick Verdict: Match Your Analytics to Your Content Type
Choose visual analytics if you produce motion graphics, animated charts, or video content where viewer attention patterns matter more than page views. Choose traditional analytics if your content is primarily text-based reports or static infographics where session duration tells the full story.
For finance content creators working with dynamic visualizations, visual analytics delivers the granular feedback loops needed to iterate quickly. Traditional analytics remains valuable for understanding traffic sources and conversion funnels, but it cannot tell you which chart animation held attention or where viewers disengaged from your data narrative.
Criterion | Visual Analytics | Traditional Analytics | Winner |
|---|---|---|---|
Real-time insights | Sub-minute feedback on viewer behavior | 24-48 hour processing delays common | Visual Analytics |
Engagement depth | Tracks attention, interaction, completion | Views, session duration, bounce rate | Visual Analytics |
Setup complexity | Requires integration with content tools | Simple tag implementation | Traditional |
Cost structure | Higher per-seat pricing | Free tiers widely available | Traditional |
Video-specific metrics | Watch time curves, replay patterns | Basic play counts only | Visual Analytics |
Cross-platform tracking | Platform-dependent limitations | Unified dashboards available | Traditional |
Actionable insights | Direct content optimization signals | Requires interpretation layer | Visual Analytics |
Evaluation Criteria: What Matters for Finance Content
Finance audiences demand accuracy and clarity. Your analytics should measure whether you delivered both. We evaluate these approaches across seven dimensions, weighted toward what finance content creators prioritize most.
Real-time insights matter because financial data moves fast. Content published today about market conditions needs immediate feedback to inform tomorrow's production. Engagement metrics depth determines whether you understand attention or just access. Setup complexity affects adoption, especially for lean teams without dedicated analytics staff.
Cost structure impacts sustainability for independent creators and small teams. Video-specific metrics matter because short-form videos under one minute achieve average engagement rates of 50%, making granular video analytics essential. Cross-platform tracking addresses the reality that finance content lives across YouTube, LinkedIn, Twitter, and embedded players. Actionable insights close the loop between measurement and production decisions.
Head-to-Head Breakdown
Real-Time Insights: Speed of Feedback Loops
Visual analytics platforms deliver sub-minute feedback on viewer behavior. You can see which segments of your animated chart held attention and which triggered drop-offs while the content is still being shared. This immediacy enables same-day iteration on content strategy.
Traditional analytics, including Google Analytics, processes data in batches. Reports often reflect activity from 24 to 48 hours prior. For evergreen content, this delay is acceptable. For time-sensitive financial analysis, it creates a blind spot during the critical first hours of distribution.
Verdict: Visual analytics wins for finance creators publishing time-sensitive content. Traditional analytics remains adequate for quarterly reports or educational content with longer shelf lives.
Engagement Metrics Depth: Beyond Surface Numbers
Traditional analytics measures what happened: page views, session duration, bounce rates. Businesses monitoring engagement metrics saw a 34% increase in customer retention and 48% higher conversion rates in 2024. But these metrics describe outcomes, not behavior patterns.
Visual analytics tracks how engagement unfolds. Heat maps show where attention concentrated. Scroll depth and replay patterns reveal which data visualizations resonated. For finance content creators, this granularity answers the question traditional analytics cannot: did viewers understand your chart, or did they just see it?
Verdict: Visual analytics delivers the depth finance creators need. If your content includes motion graphics or interactive elements, surface metrics miss the story.
Setup Complexity: Time to First Insight
Traditional analytics wins on simplicity. A single tracking tag provides comprehensive website analytics within hours. Google Analytics, Plausible, and similar platforms require minimal technical expertise to implement.
Visual analytics platforms often require integration with your content creation and hosting tools. Video analytics needs player-level instrumentation. Interactive chart analytics requires custom event tracking. For teams without development resources, this creates friction.
Verdict: Traditional analytics for teams prioritizing speed to deployment. Visual analytics for teams willing to invest setup time for deeper insights.
Cost Structure: Budget Realities
Google Analytics remains free for most use cases. Traditional analytics platforms offer generous free tiers that cover the needs of individual creators and small teams.
Visual analytics platforms typically charge per seat or by data volume. Advanced video analytics, heatmapping tools, and real-time dashboards carry subscription costs that add up. For finance content creators operating independently, these costs require justification through measurable content improvements.
Verdict: Traditional analytics for budget-constrained creators. Visual analytics justifies its cost when content optimization directly impacts revenue or audience growth.
Video-Specific Metrics: Measuring Motion
This is where traditional analytics fails most visibly. 74% of companies measure video ROI using engagement metrics like views, view rate, and average watch time. Yet traditional analytics provides only basic play counts and completion rates.
Visual analytics for video content tracks watch time curves, identifying exact moments of engagement and disengagement. Replay patterns reveal which segments viewers found valuable enough to revisit. For animated financial charts, this feedback directly informs animation pacing and data sequencing decisions.
Verdict: Visual analytics is essential for video-first finance content. Traditional analytics cannot provide the granularity video optimization requires.
Cross-Platform Tracking: Unified Views
Traditional analytics excels at aggregating data across touchpoints. Google Analytics and similar platforms provide unified dashboards showing how audiences move between your website, landing pages, and conversion points.
Visual analytics often operates within platform silos. YouTube analytics stays in YouTube. LinkedIn video metrics stay in LinkedIn. Achieving a unified view requires third-party aggregation tools or manual consolidation. Global social media engagement grew by 21% in Q1 2025, driven by visual content distributed across multiple platforms, making this limitation increasingly problematic.
Verdict: Traditional analytics for multi-platform distribution strategies. Visual analytics for deep analysis within specific platforms.
Actionable Insights: Closing the Loop
Traditional analytics tells you what performed. Visual analytics suggests why. When your animated earnings chart shows a 40% drop-off at the 15-second mark, visual analytics provides the behavioral context to diagnose the problem. Was the animation too slow? Did the data labeling confuse viewers?
For finance content creators, actionable insights reduce production iteration cycles. Instead of guessing why content underperformed, you receive specific signals about attention patterns, interaction points, and comprehension indicators.
Verdict: Visual analytics for creators who iterate on content based on performance data. Traditional analytics for those focused primarily on distribution optimization.
Use Case Mapping: Which Approach Fits Your Workflow
If you produce daily market commentary videos, choose visual analytics. The speed of real-time insights enables same-day content adjustments. You need to know immediately whether your chart animations are landing.
If you publish monthly research reports with embedded visualizations, traditional analytics may suffice. The longer content lifecycle allows for batch processing delays, and session duration metrics adequately measure deep engagement with long-form content.
If you create animated explainers for complex financial concepts, choose visual analytics. Understanding where viewers replay segments or disengage reveals comprehension gaps that surface metrics cannot detect.
If you primarily drive traffic to conversion pages, traditional analytics provides the funnel visibility you need. Visual analytics adds value only if the content itself requires optimization.
If you operate across multiple platforms simultaneously, neither approach solves the fragmentation problem elegantly. Consider traditional analytics for unified traffic views, supplemented by platform-native visual analytics for content-specific optimization.
What Both Approaches Get Wrong
Neither visual nor traditional analytics solves the attribution problem for finance content. When a viewer watches your animated chart, shares it, and their colleague later subscribes to your newsletter, connecting those dots remains difficult. Both approaches struggle with cross-device tracking and privacy-conscious audiences who block tracking entirely.
Both also fail to measure comprehension directly. Average time on page increased to 3:18 minutes in 2025 from 2:05 minutes in 2023, but time spent does not equal understanding. For finance content creators focused on accuracy, no analytics platform can confirm that viewers correctly interpreted your data visualization.
Migration and Switching Considerations
Switching from traditional to visual analytics involves more than changing tools. Historical data rarely migrates cleanly between platforms. You lose year-over-year comparisons and baseline benchmarks established in your previous system.
The learning curve matters. Visual analytics platforms require new mental models for interpreting data. Teams accustomed to bounce rates and session duration need training to extract value from heatmaps and attention curves. Budget 2 to 4 weeks for meaningful adoption.
Lock-in factors differ by platform. Traditional analytics using standard implementations (Google Analytics, for example) allows relatively easy switching. Visual analytics platforms with proprietary tracking codes create deeper dependencies. Evaluate data export capabilities before committing.
Switching makes sense when your content format evolves. If you transition from static reports to animated visualizations, your analytics should evolve too. The cost of inadequate measurement compounds over time through suboptimal content decisions.
Final Recommendation: Build a Layered Approach
For finance content creators producing visual and video content, the answer is not either/or. Use traditional analytics as your foundation for traffic analysis, conversion tracking, and cross-platform visibility. Layer visual analytics on top for content-specific optimization, particularly for animated charts, motion graphics, and video content.
Prioritize visual analytics investment for your highest-stakes content. If animated earnings visualizations drive your audience growth, instrument them with granular tracking. Reserve traditional analytics for supporting content where surface metrics provide adequate signal.
Tools like Flowi that automate motion graphics production integrate naturally with visual analytics workflows. When your content creation process is streamlined, you have more bandwidth to analyze performance and iterate. The goal is not more data, but faster cycles between insight and action.
Frequently Asked Questions
What is data visualization and why is it important for audience engagement?
Data visualization transforms complex numerical information into visual formats like charts, graphs, and motion graphics. For finance content, effective visualization reduces cognitive load and accelerates comprehension. Audiences engage longer with content they understand quickly. Companies tracking session duration and returning visitor rates report 2.5x higher loyalty in key demographics, suggesting that clear visual communication directly impacts audience retention.
How can interactive charts improve audience engagement?
Interactive charts transform passive viewers into active participants. When audiences can filter data, hover for details, or adjust parameters, they invest more attention in your content. This interaction generates behavioral data that static content cannot capture. Visual analytics platforms track these interactions, revealing which data points audiences explore most and where interest drops off.
Which metrics are most important to track in an audience engagement analysis?
For video and animated content, prioritize watch time curves, replay patterns, and drop-off points over simple view counts. For interactive visualizations, track interaction frequency, time to first interaction, and exploration depth. Video marketers commonly quantify ROI using views (67%) and engagement metrics like shares and reposts (63%), but these surface metrics miss the behavioral nuances that inform content optimization.
What are best practices for designing effective data visualizations?
Lead with the insight, not the data. Structure your visualization to answer a specific question within the first few seconds. Use animation purposefully to guide attention, not to decorate. Test comprehension with sample audiences before wide distribution. Build feedback loops using visual analytics to identify which design choices correlate with higher engagement and completion rates.
How can I interpret trends in my audience engagement data?
Look for patterns across content types rather than individual pieces. If animated charts consistently outperform static ones, that signals a format preference. If drop-offs cluster at similar timestamps across videos, examine what happens at those moments. Compare engagement curves between successful and underperforming content to identify distinguishing characteristics. Avoid over-indexing on single data points.
Why do traditional analytics fall short for video content measurement?
Traditional analytics platforms were designed for page-based web content. They measure whether someone arrived and how long they stayed, but not how they engaged with dynamic elements. Video requires second-by-second attention tracking, segment-level analysis, and replay detection. The definition of a "view" varies across platforms, making cross-platform comparison unreliable without standardized visual analytics instrumentation.
Sources
Read Next
Continue Exploring

7 Visualization Techniques That Make Data Stories Click
Discover visualization techniques that transform raw data into compelling stories. Strategic methods for finance creators to boost engagement and retention.

AI Visualization Tools Are Building Toll Booths
The AI visualization market is moving to credit-based pricing. Learn how this shift impacts finance content workflows and what creators should do now.
Blender for Animation vs After Effects: Finance Creator Guide
Compare Blender for animation vs After Effects for finance content. Discover which workflow delivers better results for data visualization and market graphics.