
7 Visualization Techniques That Make Data Stories Click
Discover visualization techniques that transform raw data into compelling stories. Strategic methods for finance creators to boost engagement and retention.
11 articles
Discover visualization techniques that transform raw data into compelling stories. Strategic methods for finance creators to boost engagement and retention.
Compare Blender for animation vs After Effects for finance content. Discover which workflow delivers better results for data visualization and market graphics.

The AI visualization market is moving to credit-based pricing. Learn how this shift impacts finance content workflows and what creators should do now.
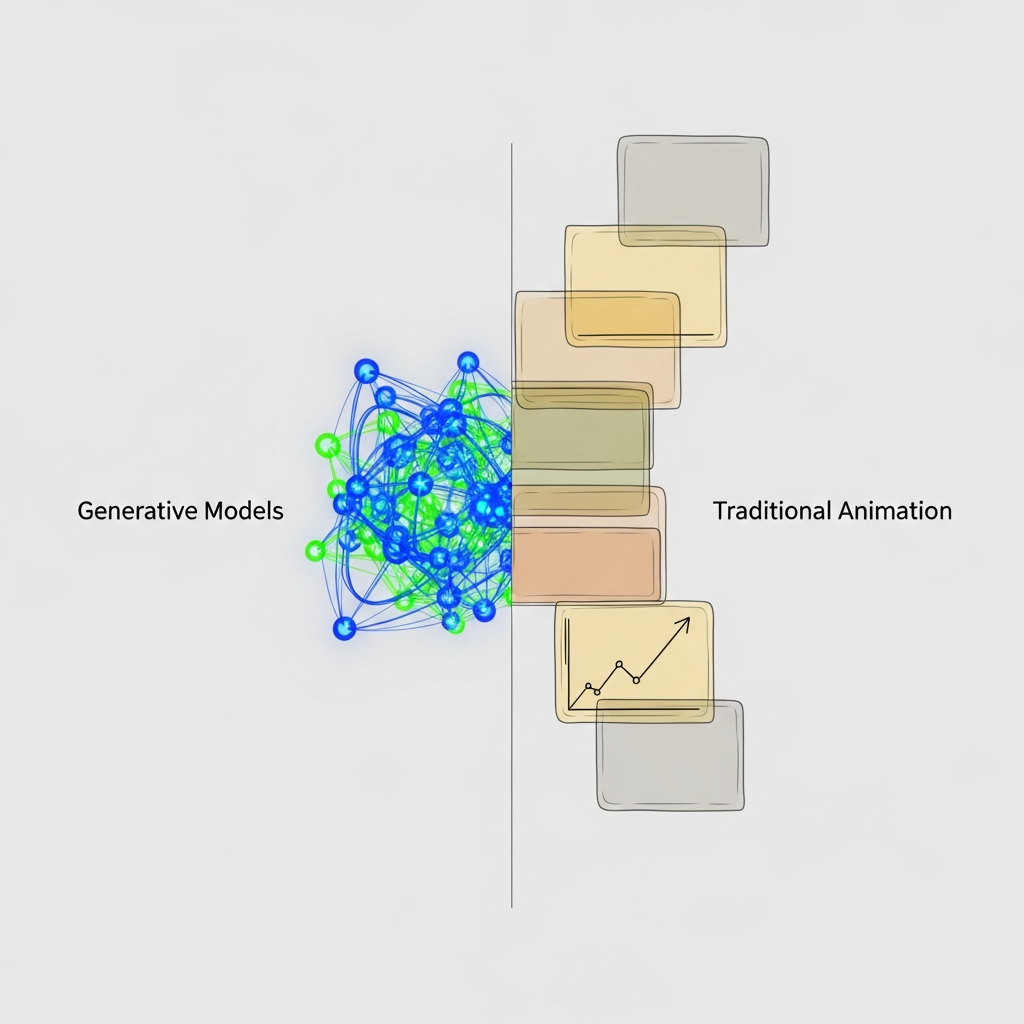
Compare generative models vs traditional animation for finance content. See how AI model training impacts production speed, data accuracy, and costs for crea...

Compare dynamic models and static visuals for finance content. Discover which approach drives better engagement based on your platform, timeline, and data type.
Discover how AI-powered analytics extracts granular audience insights from user interaction tracking. A practical guide for finance content creators.
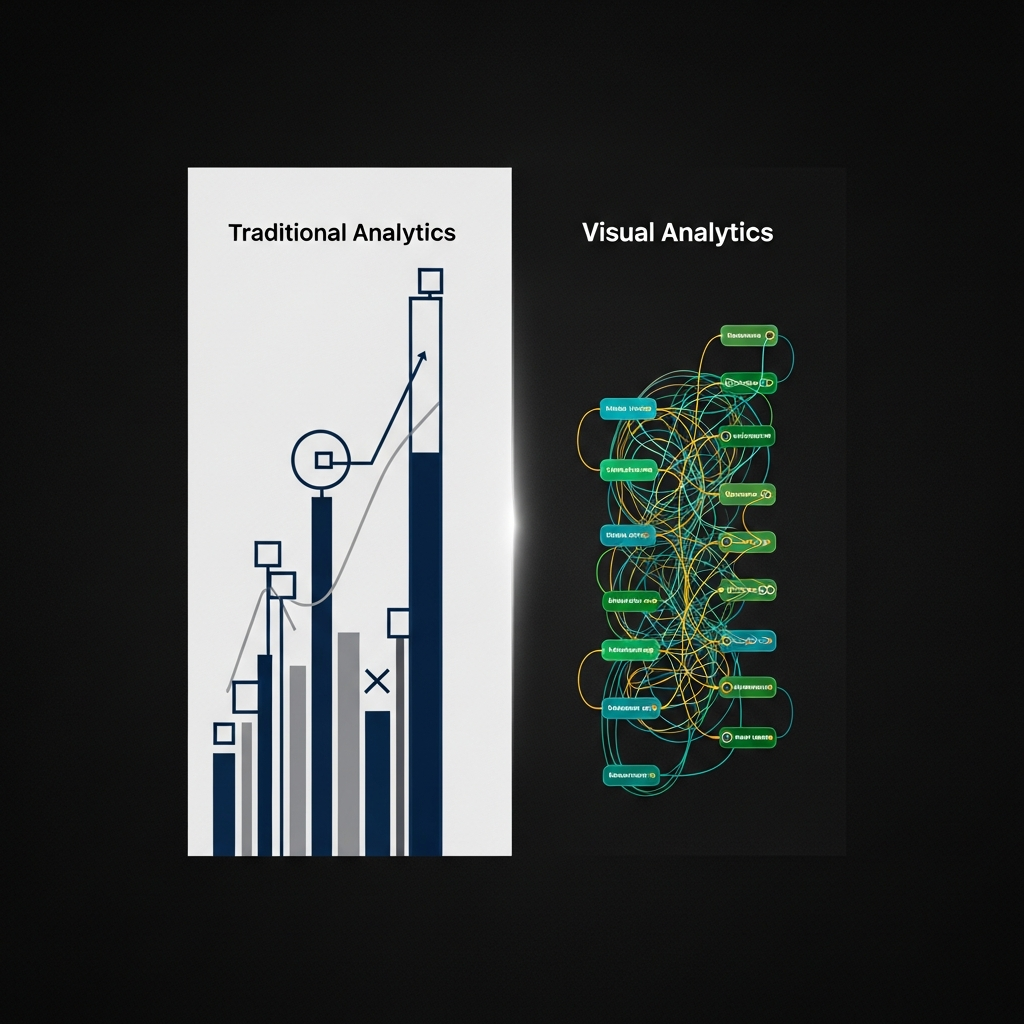
Compare visual analytics vs traditional analytics for finance content. See how real-time engagement metrics help creators optimize charts, videos, and data v...

Data democratization cuts content production from weeks to hours. Learn how to eliminate bottlenecks and improve engagement rate measurement in finance content.
Discover 7 engagement metrics that reveal what your finance audience actually wants. Learn to use data storytelling insights that drive real audience engagem...

Learn how interactive data visualization helps finance creators boost audience engagement. Practical frameworks for visual storytelling and workflow automation.

Learn how to integrate visual communication tools with engagement metrics. A practical framework for finance creators building sustainable audience growth.