How dynamic models and automated data binding are reshaping financial content production for creators without agency support
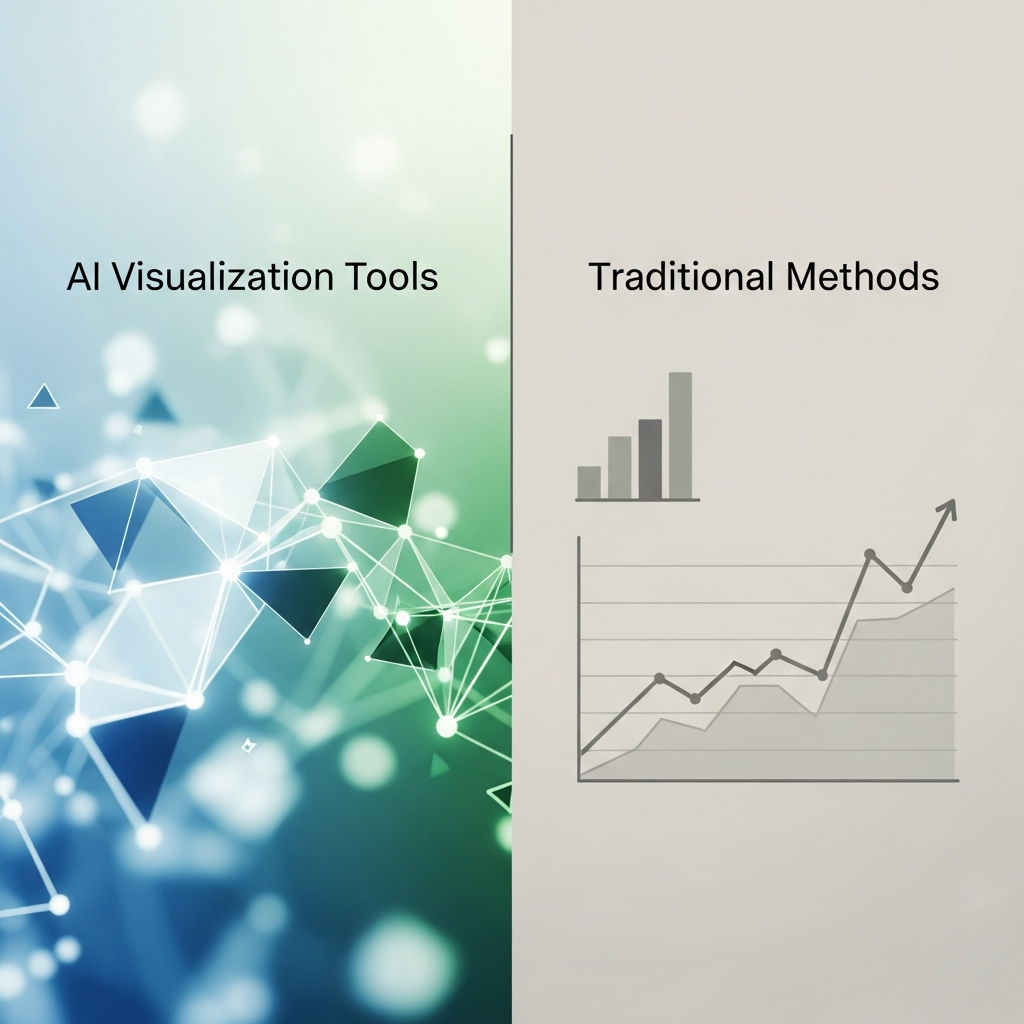
Discover which visualization approach fits your workflow. This comparison evaluates AI tools against traditional methods on accuracy, efficiency, and visual quality for finance creators publishing regular content.
TL;DR
AI tools win on accuracy - Automated data binding eliminates manual transcription errors that plague traditional animation workflows
Speed advantage is decisive - AI visualization produces in minutes what traditional methods require days to complete, enabling consistent publishing schedules
Traditional methods retain creative edge - For highly customized brand aesthetics or documentary-style content, manual animation offers unlimited flexibility
Cost favors AI for most creators - Subscription models beat freelancer fees unless you produce 50+ videos annually with complex requirements
Start with AI, scale to hybrid - Most finance-focused YouTubers should adopt AI tools now and add traditional capabilities only when specific content demands it
The Real Decision: AI Visualization Tools vs. Traditional Methods for Financial Content
Finance-focused YouTubers face a specific challenge. They need to transform complex datasets into compelling visual narratives that audiences actually understand and trust. The decision between AI visualization tools and traditional methods (think After Effects, manual charting, or outsourced animation) directly impacts production speed, data accuracy, and ultimately, channel growth.
This comparison addresses creators producing regular financial content who cannot afford week-long production cycles for each video. We evaluate based on accuracy preservation, production efficiency, and visual quality, the three factors that determine whether your audience stays or scrolls.
Quick Verdict: Which Approach Fits Your Workflow
Choose AI visualization tools if you publish frequently, work with live or updating data, and need to maintain accuracy without a dedicated motion graphics team. Choose traditional methods if you have established production pipelines, require highly customized brand aesthetics, and can absorb longer turnaround times.
For most finance creators operating without agency support, AI tools now deliver superior value per hour invested. The AI visualization market is projected to grow by $28.68 billion through 2029, reflecting this shift in how financial content gets made.
Criterion | AI Visualization Tools | Traditional Methods | Winner |
|---|---|---|---|
Data Accuracy | Automated data binding reduces human error | Manual input increases transcription risk | AI Tools |
Production Speed | Minutes to hours | Days to weeks | AI Tools |
Visual Customization | Template-based with growing flexibility | Unlimited creative control | Traditional |
Learning Curve | Moderate (tool-specific) | Steep (software mastery required) | AI Tools |
Cost Structure | Subscription-based, predictable | High upfront (software + talent) | Depends on scale |
Update Flexibility | Quick revisions when data changes | Significant rework required | AI Tools |
Evaluation Criteria: What Actually Matters for Financial Animation
Data Accuracy ranks highest. Financial content lives or dies by credibility. One misplaced decimal point erodes trust built over months. We weight this criterion heavily because your audience includes viewers making real financial decisions.
Production Velocity determines sustainability. 76% of finance professionals have automated reporting with AI, yet content creation lags behind. Speed without accuracy is worthless, but accuracy without speed means missed market moments.
Visual Quality affects retention. Dynamic models and smooth animations keep viewers engaged through complex explanations. However, quality must serve clarity, not distract from it.
Revision Efficiency matters when earnings reports update or you catch an error post-render. How quickly can you fix and re-export?
Head-to-Head: Data Accuracy in Animated Reports
AI Visualization Tools
Modern AI tools like Flowi connect directly to data sources, eliminating manual data entry. When you update a spreadsheet, the visualization updates automatically. This data binding approach reduces transcription errors to near zero for supported chart types.
The limitation appears with unconventional data formats or highly specialized financial instruments. AI tools work best with structured data they recognize. Edge cases may require manual adjustment.
Traditional Methods
After Effects and similar software offer no native data connection. Every number gets typed, copied, or imported manually. Skilled editors develop verification workflows, but human error remains inherent to the process.
The advantage emerges in flexibility. Traditional tools can visualize anything you can imagine, regardless of data structure. Complex derivatives, custom indicators, or proprietary metrics pose no technical barrier.
Verdict
For standard financial data (stock prices, earnings, economic indicators), AI tools deliver superior accuracy through automation. For exotic instruments or highly custom visualizations, traditional methods remain necessary despite higher error risk.
Head-to-Head: Production Speed and Workflow
AI Visualization Tools
Domain-specific AI tools generate animated charts in minutes. Flowi, for example, automates After Effects-quality output without requiring timeline editing. You input data, select visualization type, and export. This workflow suits creators publishing multiple videos weekly.
The constraint involves template boundaries. While templates accelerate production, they also limit deviation from established visual patterns.
Traditional Methods
A skilled motion designer needs 4 to 8 hours minimum for a polished 60-second financial animation. Complex sequences with multiple data transitions can extend to days. This timeline assumes no revisions.
Traditional workflows excel when you need a signature visual style that distinguishes your channel. The investment pays off in brand recognition, assuming you have the budget and timeline.
Verdict
AI tools win decisively on speed for standard financial content. Traditional methods justify their time investment only for flagship content or channels with established visual identities worth maintaining.
Head-to-Head: Visual Quality and Dynamic Models
AI Visualization Tools
The AI visualization market has matured rapidly. Current tools produce animations that match professional motion graphics studios for common chart types. Dynamic models adapt to data ranges automatically, maintaining visual balance regardless of input values.
AI models improve over time, adapting to changes like market shifts and economic trends. This adaptability extends to visualization, where tools learn from usage patterns to suggest better presentation options.
Traditional Methods
Nothing matches the creative ceiling of professional motion graphics software. Custom easing curves, particle effects, 3D camera movements, and brand-specific animations remain the domain of traditional tools.
However, this quality requires expertise. The gap between amateur and professional After Effects work is vast. Without significant skill investment, traditional tools often produce worse results than AI alternatives.
Verdict
For finance-focused YouTubers without motion graphics training, AI tools deliver higher quality output. For creators with design backgrounds or agency partnerships, traditional methods offer superior creative expression.
Head-to-Head: Cost and Scalability
AI Visualization Tools
Subscription models range from $20 to $200 monthly depending on features and output volume. Costs scale predictably with usage. No additional software purchases or freelancer fees required.
Leading financial institutions invest over $35 billion in AI for 2025, representing over 35% of IT budgets. This enterprise adoption drives tool improvement that benefits individual creators through better, more affordable products.
Traditional Methods
Adobe After Effects costs $23 monthly, but that covers only the software. Freelance motion designers charge $50 to $150 hourly. A single video's animation budget can exceed an entire year of AI tool subscriptions.
At scale, traditional methods can become cost-effective through in-house talent. But reaching that scale requires significant upfront investment and consistent content volume to justify full-time hires.
Verdict
AI tools win on cost for creators producing under 50 videos annually. Above that threshold, hybrid approaches or dedicated staff may offer better economics depending on complexity requirements.
Use Case Mapping: When to Choose Each Approach
If you publish weekly market updates, choose AI visualization tools. The speed advantage compounds over time, and data accuracy automation prevents embarrassing corrections.
If you create documentary-style deep dives quarterly, choose traditional methods. The extended timeline justifies custom animation investment, and distinctive visuals reinforce premium positioning.
If you cover breaking financial news, choose AI tools exclusively. Hours matter when markets move. 55% of finance teams using AI rely on it for data analysis, and visualization should follow the same speed imperative.
If you maintain strict brand guidelines from a media company, choose traditional methods or negotiate template customization with AI tool providers.
If you operate solo without design skills, choose AI tools. The learning curve for professional motion graphics spans years. AI tools deliver professional results within days of adoption.
What Both Approaches Get Wrong
Neither AI tools nor traditional methods solve the fundamental challenge of data sourcing. Garbage in, garbage out applies regardless of how beautifully you animate it. Both approaches assume you have clean, verified data to visualize.
Additionally, neither approach addresses narrative structure. Tools can animate your data, but they cannot tell you which data matters or how to sequence insights for maximum comprehension. That editorial judgment remains entirely human.
The industry still lacks seamless integration between data verification, visualization, and distribution. Creators cobble together workflows from multiple tools regardless of which animation approach they choose.
Migration and Switching Considerations
Switching from traditional to AI tools involves minimal friction. Your existing data sources work with new tools. The primary cost is learning time, typically measured in hours rather than weeks.
Moving from AI to traditional methods requires significant investment. You need software licenses, skill development, and likely freelancer relationships. Budget 3 to 6 months to reach equivalent production quality.
Lock-in concerns favor AI tools. Most export standard video formats with no proprietary dependencies. Traditional software projects can become locked to specific versions or plugins, creating technical debt over time.
Consider switching when your content volume changes dramatically or when visual requirements exceed your current approach's capabilities. By 2025, 85% of financial institutions will have integrated AI into operations, up from 45% in 2022. The trend direction is clear.
Final Recommendation: Making the Decision
For finance-focused YouTubers prioritizing data accuracy in animated reports, AI visualization tools represent the stronger choice in 2025. The accuracy advantages from automated data binding, combined with production speed that enables consistent publishing, outweigh the creative limitations for most use cases.
Choose AI tools like Flowi if you value accuracy automation, publish regularly, and lack motion graphics expertise. Choose traditional methods if you have established creative workflows, require unlimited customization, and can absorb longer production cycles.
The global AI in finance market reaching $190.33 billion by 2030 signals where investment flows. Aligning your content production with that trajectory positions your channel for sustainable growth. Start with AI tools, graduate to hybrid approaches if your scale and requirements demand it.
Frequently Asked Questions
What is AI animation in data visualization?
AI animation in data visualization refers to automated systems that transform raw data into moving graphics without manual keyframing. These tools use algorithms to determine optimal chart types, animation timing, and visual hierarchy based on the data you provide. For financial content, this means stock charts, earnings comparisons, and economic indicators can animate automatically while maintaining data accuracy.
How do AI visualization tools maintain data accuracy in financial animations?
AI tools maintain accuracy through direct data binding. Instead of manually typing numbers into animation software, you connect your data source (spreadsheet, API, database) directly to the visualization tool. When data changes, animations update automatically. This eliminates transcription errors that occur when humans copy figures between applications.
When should finance creators consider switching from traditional animation to AI tools?
Consider switching when production bottlenecks limit your publishing frequency, when you catch data errors in finished videos regularly, or when animation costs consume disproportionate budget share. If you spend more time on visuals than analysis, AI tools can rebalance that ratio. Most creators benefit from switching when they publish more than twice monthly.
What challenges do AI-driven animations face in maintaining scientific and financial accuracy?
AI tools struggle with unconventional data formats, proprietary metrics, and complex financial instruments that fall outside their training data. They may also apply inappropriate visualization types if not properly configured. Human oversight remains essential for verifying that automated outputs correctly represent the underlying data, especially for novel or complex financial concepts.
Can AI visualization tools match the quality of professional motion graphics studios?
For standard financial charts and common visualization types, yes. Current AI tools produce animations comparable to professional studio output. However, they cannot match custom creative work involving unique visual metaphors, complex 3D sequences, or highly branded design systems. The gap narrows annually as AI capabilities expand.
How do dynamic models in AI visualization adapt to changing financial data?
Dynamic models automatically adjust scale, timing, and visual elements based on data characteristics. If your dataset spans different ranges month to month, the visualization adapts without manual adjustment. This proves particularly valuable for financial content where market volatility can dramatically shift data ranges between reporting periods.
Sources
Read Next
Continue Exploring
After Effects Alternatives for Finance Creators
Compare After Effects alternatives for finance creators. Find motion graphics tools that streamline chart animations, data visualization, and financial expla...

How to Create Interactive Financial Presentations in 90 Minutes
Create interactive visualizations that boost engagement. This 90-minute tutorial shows you how to build animated financial presentations with hover-responsiv...

5 Benefits of Multi-Image Fusion for Financial Narratives
Learn 5 ways multi-image fusion elevates financial narratives with better visual fidelity, faster turnaround, and stronger investor engagement.