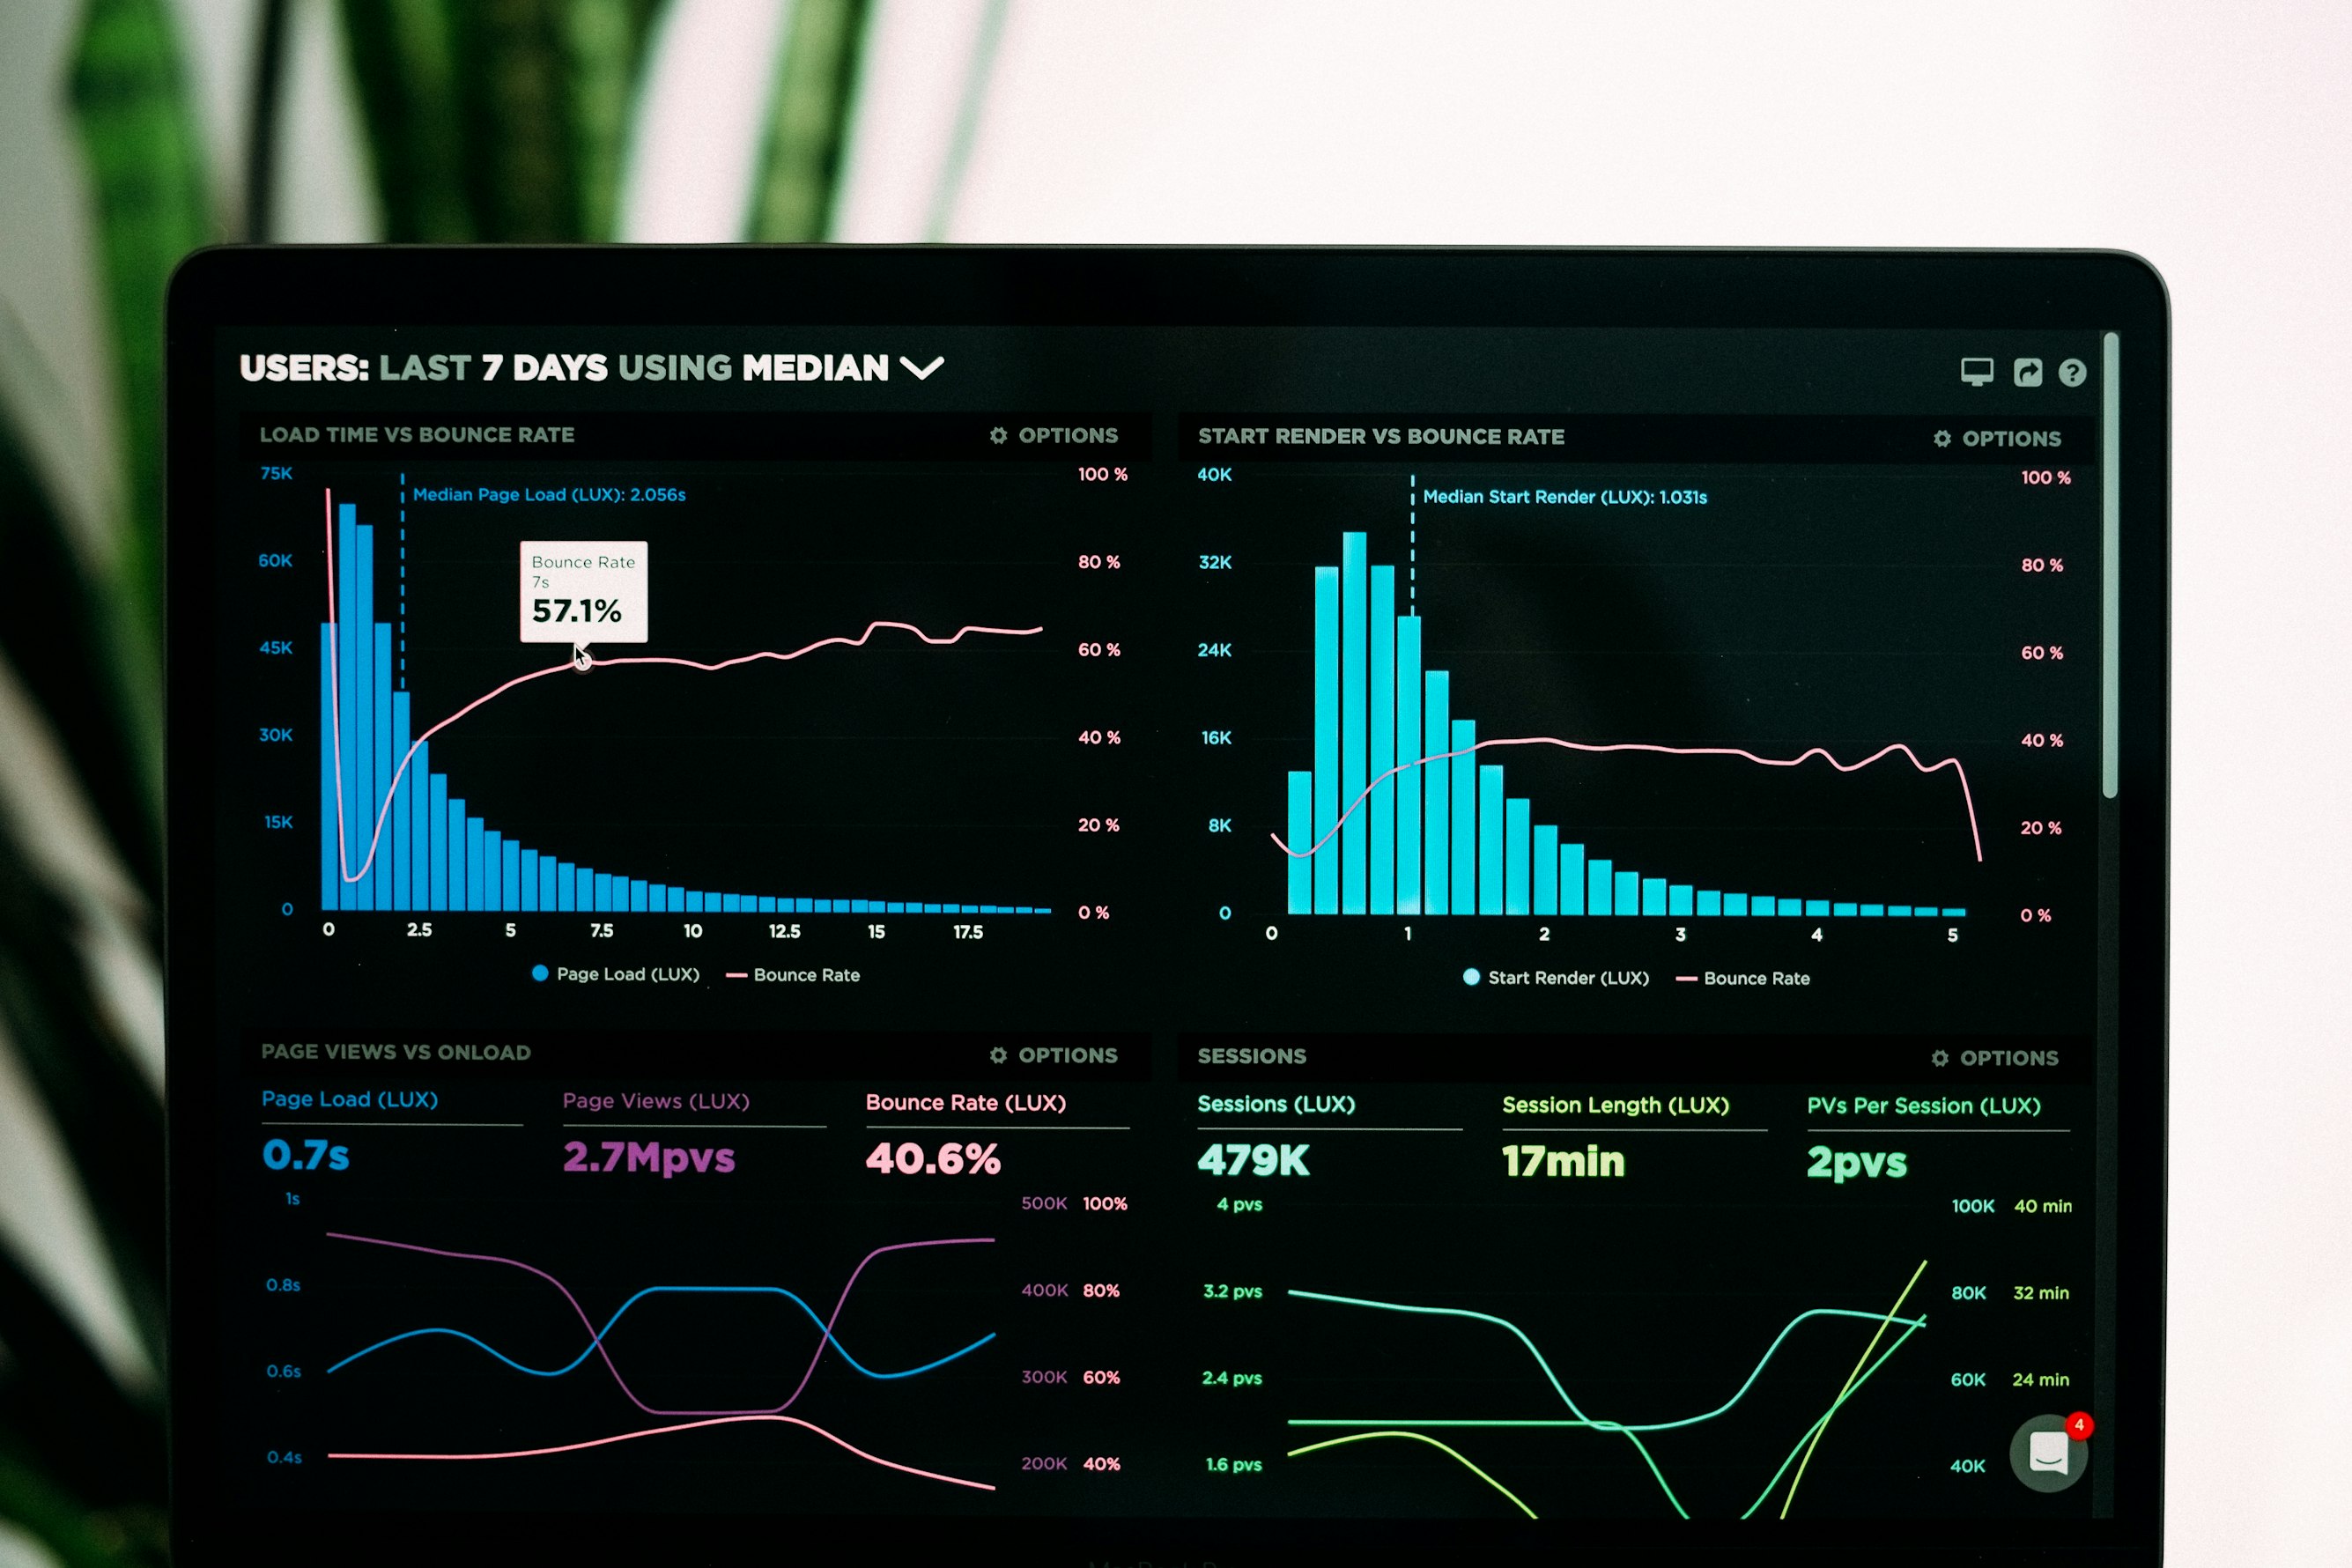
“Next slide, please.” It is the phrase that puts boardrooms to sleep. In a world dominated by high-production content, static slides don’t hold attention. Your prospects watch polished video content all day on social media, YouTube, and streaming platforms. Then they walk into your meeting and see a wall of bullet points. The gap between what they expect and what they get is where you lose deals.
Motion graphics bridge that gap. They transform dry numbers into visual stories that prospects actually remember. Research consistently shows that people retain far more information from animated visuals than from static text. And in a sales context, retention is everything — if your prospect can’t recall your key differentiators 24 hours later, you’ve lost the deal to whoever presented last.
Here are five specific ways to use motion graphics in your next sales presentation, along with practical tips for making each one work.
1. The ‘Race’ Bar Chart
Use motion graphics to show the bars growing and overtaking each other over the timeline. This adds narrative tension to your victory.
Instead of showing a static comparison of your product versus competitors, animate the bars so they grow in real time across quarters or years. The audience watches your bar start small, then steadily climb and overtake the competition. This creates a storytelling arc within a single chart — there is a beginning, a struggle, and a payoff.
How to make it work:
- Keep the animation duration between 5 and 10 seconds. Any longer and you lose momentum. Any shorter and the effect is lost.
- Use your brand color for your bar and neutral grays for competitors. The eye naturally follows the brightest element.
- Add a subtle sound effect or pause in your narration right as your bar takes the lead. That moment of overtaking is where the emotional impact lives.
- Label the axes clearly. The animation should enhance understanding, not replace it.
2. The Expanding Territory Map
Seeing a map light up region by region provides an instant sense of scale and momentum.
Territory maps are especially powerful for companies pitching geographic expansion, market coverage, or logistics capabilities. Rather than showing a fully shaded map from the start, animate each region lighting up in the order you entered those markets. This turns a static fact (“we operate in 40 states”) into a visual narrative of growth.
How to make it work:
- Start with a dark or desaturated map and illuminate regions with your brand color as they activate.
- Sync the animation to your talking points. As you mention a region or milestone, that area should light up on cue.
- Add a running counter in the corner showing total regions, customers, or revenue as the map fills in. The combination of geographic spread and growing numbers is compelling.
- If you serve international markets, consider a globe view that rotates to highlight each region. The perspective shift keeps the visual fresh.
3. Kinetic Typography for Testimonials
Force the viewer to read at your pace, ensuring they absorb critical keywords.
Reading a block quote on a slide is passive. The prospect might skim it, might skip it entirely. Kinetic typography solves this by revealing the testimonial word by word or phrase by phrase, with key terms appearing larger, bolder, or in a different color. The prospect has no choice but to follow along.
How to make it work:
- Pull the two or three strongest phrases from a longer testimonial. You don’t need the full quote — just the parts that speak directly to the prospect’s pain points.
- Emphasize numbers and outcomes. If the testimonial says “reduced costs by 40%,” make “40%” appear in a larger size or brighter color.
- Keep the background simple. A dark background with white or light-colored text works best for readability and focus.
- Time it to finish in under 15 seconds. Kinetic typography loses its punch if it drags on.
4. The ‘Count Up’ Effect for KPIs
Watching a counter tick from $0 to $1M creates psychological anticipation.
There is something deeply satisfying about watching numbers climb. It is the same reason donation thermometers and crowdfunding progress bars are so effective. When you display a KPI as a count-up animation, the prospect’s brain is engaged the entire time the number is rising. By the time it lands on the final figure, the impact is far greater than if that number had simply appeared on screen.
How to make it work:
- Use the count-up effect for your three to five most important metrics. Revenue growth, customer count, cost savings, and time-to-value are all strong candidates.
- Stagger the counters so they don’t all run at once. Present one metric, let it land, then move to the next. Each one gets its own moment.
- Add a brief pause after the counter reaches its final number before you speak. Let the figure sit on screen for two to three seconds so it sinks in.
- Pair the counter with a simple icon or label so the audience immediately understands what the number represents.
5. Isolated Trend Line Reveals
Introduce visual elements sequentially to control the narrative and prevent cognitive overload.
Complex charts with multiple data series are one of the biggest pitfalls in sales presentations. When everything appears at once, the prospect doesn’t know where to look. Animated trend line reveals solve this by introducing one line at a time, letting you explain each data series before adding the next.
How to make it work:
- Start with the baseline or industry average. Give the audience a reference point before showing your data.
- Draw your trend line in with a smooth animation, as if it is being plotted in real time. This draws the eye along the trajectory and makes the trend direction unmistakable.
- Use color strategically. The first line can be gray (the benchmark), and your performance line should be in a bold, contrasting color.
- If you are comparing before and after, reveal the “before” line first, pause for your commentary, then animate the “after” line. The visual contrast tells the story for you.
Putting It All Together
You don’t need to use all five techniques in a single presentation. Pick the two or three that best match your data and your audience. A short pitch to a C-suite executive might use a count-up effect for headline KPIs and a race bar chart for competitive positioning. A longer demo for a technical buyer might lean on trend line reveals and territory maps.
The key principle across all of these techniques is the same: motion controls attention, and attention drives conversion. When you decide what the prospect sees and when they see it, you control the narrative. That is something a static slide deck can never do.
Transform your next pitch deck
Create professional animated charts and maps in minutes with Flowi.
Make Your Data Move →Read Next
Continue Exploring
5 Benefits of Multi-Image Fusion for Financial Narratives
Learn 5 ways multi-image fusion elevates financial narratives with better visual fidelity, faster turnaround, and stronger investor engagement.

7 Elements That Make Financial Animations Trustworthy
Discover the key elements of high-fidelity animation that build audience trust in financial content. Essential guide for creators who prioritize accuracy.

7 Visualization Techniques That Make Data Stories Click
Discover visualization techniques that transform raw data into compelling stories. Strategic methods for finance creators to boost engagement and retention.