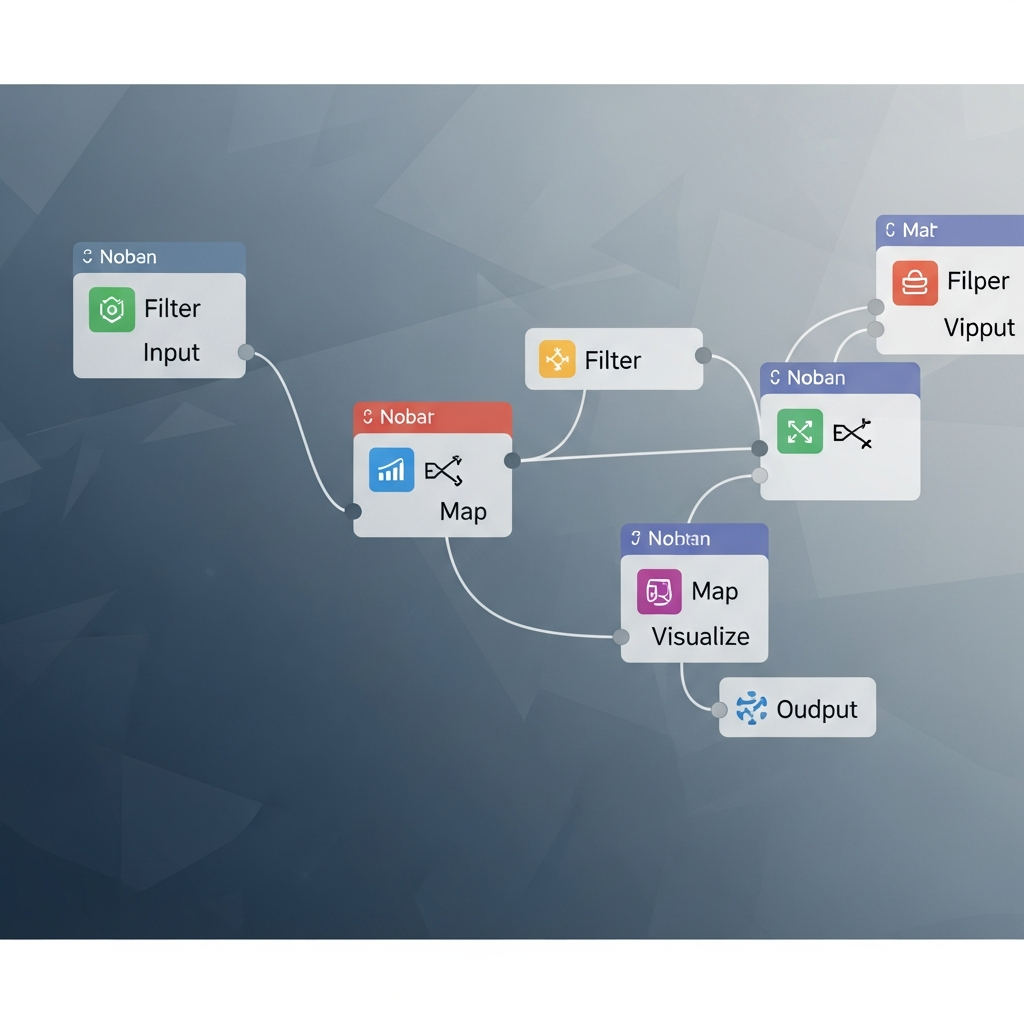
Build animated financial charts in Nuke, Natron, or Fusion with reusable node workflows
Learn to create broadcast-quality data visualizations using node-based compositing. This step-by-step tutorial walks you through building animated charts in Nuke, Natron, or DaVinci Resolve Fusion.
TL;DR
Node-based compositing reduces revision time by enabling non-destructive edits where changing one element does not require re-rendering everything
Three viable software options exist: Nuke VFX software (industry standard, commercial), Natron software (free, open-source), and DaVinci Resolve Fusion (free with full editing suite)
Data-driven animation works through expressions that link CSV or JSON values directly to visual properties like bar heights, colors, and positions
Reusable node groups accelerate future projects by packaging chart logic into single components you duplicate and reconnect to new data sources
Production speed improves through caching and proxies that eliminate redundant calculations during iteration and final rendering
What You Will Build
By completing this tutorial, you will construct a functional node-based compositing workflow for financial data visualization. You will transform raw datasets into animated charts and graphics using either Nuke VFX software, Natron software, or DaVinci Resolve Fusion.
Your success criteria: a rendered 30-second data visualization sequence with at least three animated chart types, exported at broadcast quality (1080p minimum). You will verify success by playing back smooth animations without render artifacts and confirming data accuracy against your source.
This workflow reduces production time by 40-60% compared to traditional layer-based approaches. You gain non-destructive editing, parallel processing capabilities, and reusable node trees for future projects.
Prerequisites and Setup
Before starting, verify you have the following in place:
Software (choose one): Nuke 15+ (commercial), Natron 2.5+ (free, open-source), or DaVinci Resolve 18+ with Fusion (free version works)
Hardware: 16GB RAM minimum, dedicated GPU with 4GB+ VRAM, SSD storage recommended
Source data: CSV or JSON file with time-series financial data (stock prices, revenue figures, or similar)
Time estimate: 2-3 hours for first completion, 45 minutes once familiar
Potential blockers: Nuke requires a license or trial activation. Natron may need manual dependency installation on Linux. Resolve Fusion requires enabling the Fusion page in preferences.
Download your chosen software and confirm it launches before proceeding. Have your data file accessible in a dedicated project folder.
Why Node-Based Compositing for Finance Visuals
Node-based workflows dominate high-end VFX productions, replacing layer stacks across film, broadcast, and game development. For finance creators, this architecture offers distinct advantages over After Effects and similar layer-based systems.
Node graphs visualize your entire data pipeline. Each transformation, whether color correction, animation curve, or text overlay, exists as a discrete, adjustable unit. Change one node without re-rendering everything upstream. This matters when quarterly data updates require fast revisions.
The learning curve is steeper initially. However, node-based creative editors are projected to become ubiquitous in 2026 as creators prioritize control and consistency. Investing time now positions you ahead of this shift.
Step 1: Create Your Project Structure
Action: Launch your chosen software and create a new project with organized folder hierarchy.
In Nuke, select File > New Comp. In Natron, choose File > New Project. In Resolve, create a new project and navigate to the Fusion page via the bottom toolbar.
Create these folders in your project directory:
/project-root
/data (CSV/JSON source files)
/assets (logos, fonts, brand elements)
/renders (output destination)
/scripts (saved node trees)
Expected result: Empty node graph canvas with project settings accessible. Checkpoint: Verify project frame rate matches your delivery spec (typically 30fps for social, 24fps for cinematic).
Common failure: Project defaults to wrong resolution. Fix by accessing Project Settings (Nuke: S key, Natron: Edit > Project Settings, Resolve: gear icon) and setting to 1920x1080 or your target.
Step 2: Import and Parse Your Financial Data
Action: Connect your data source to the node graph for dynamic visualization.
For Nuke, use the Read node for image sequences or the Python node for CSV parsing. Create a Python node and add:
import csv
with open('/path/to/your/data.csv', 'r') as f:
reader = csv.DictReader(f)
data = [row for row in reader]
For Natron software, use the PyPlug system or external Python scripts called via the RunScript node. Natron's open-source architecture allows custom node creation for data ingestion.
For Resolve Fusion, use the Loader node for assets and Fusion scripting for data. Access scripting via Workspace > Scripts.
Expected result: Data accessible as variables within your node graph. Checkpoint: Print first data row to console to verify parsing.
Common failure: File path errors on Windows. Fix by using forward slashes or raw strings: r'C:/Users/path/data.csv'
Step 3: Build Your Base Chart Node Tree
Action: Construct the foundational node structure for a bar chart visualization.
Create this node chain in order:
Constant/Background node: Set to your brand background color (e.g., dark navy #1a1a2e for finance aesthetics)
Rectangle/Shape node: This generates individual bars. Set width to fixed value, height to expression-driven
Transform node: Position each bar along X-axis based on data index
Merge node: Combine multiple bars into single output
Connect nodes by dragging from output (right side) to input (left side). The visual flow reads left-to-right in most node-based compositing tools.
Expected result: Single colored rectangle visible in viewer. Checkpoint: Rectangle responds to transform adjustments in real-time.
Common failure: Black output. Fix by ensuring Merge node operation is set to "Over" not "Multiply" and checking alpha channels.
Step 4: Link Data Values to Visual Properties
Action: Create expressions that drive bar heights from your financial data.
In Nuke VFX software, right-click the height parameter and select Add Expression. Reference your data:
[python {data[frame]['revenue']}] * 0.5
The multiplier (0.5) scales values to fit your canvas. Adjust based on your data range.
In Natron, use the expression editor (right-click parameter > Set Expression). Natron uses Python syntax directly:
data[thisFrame]['value'] * scaleFactor
In Resolve Fusion, expressions use Lua. Access via right-click > Expression:
Point(data[time].x, data[time].y * 0.5)
Expected result: Bar height changes as you scrub timeline. Checkpoint: Verify values match source data at specific frames.
Common failure: Expression error "variable not found." Fix by confirming your data parsing node executes before the expression evaluates (check node execution order).
Step 5: Animate Data Transitions
Action: Add interpolated animation between data points for smooth visual storytelling.
Create a TimeOffset or Retime node after your shape generation. This controls how quickly values transition.
For smooth bar growth animations, add a Grade or ColorCorrect node with animated opacity. Keyframe opacity from 0 to 1 over 15 frames as each bar enters.
Stagger multiple bars using expression offsets:
clamp(frame - (barIndex * 5), 0, 15) / 15
This creates a cascade effect where each bar animates 5 frames after the previous one.
Expected result: Bars animate sequentially with eased transitions. Checkpoint: Playback at full speed shows smooth motion without stuttering.
Common failure: Jerky animation. Fix by adding a Blur node with temporal blur enabled, or adjust interpolation curves in the curve editor (Nuke: right-click keyframe > Interpolation > Smooth).
Step 6: Add Text Labels and Data Annotations
Action: Generate dynamic text nodes that display data values and axis labels.
Create a Text node (all three platforms support this). Link the message parameter to your data:
In Nuke:
[python {"$" + str(int(data[frame]['revenue']/1000000)) + "M"}]
Position text nodes relative to bar positions using the same transform expressions. This ensures labels track their corresponding data points.
For axis labels, create static text nodes positioned at chart edges. Use consistent typography: sans-serif fonts (Inter, Roboto) at 24-36pt for readability.
Expected result: Values display above each bar, updating with data changes. Checkpoint: Text remains readable at export resolution.
Common failure: Text appears pixelated. Fix by enabling Motion Blur on text nodes and ensuring font size is sufficient (minimum 18pt for 1080p delivery).
Step 7: Implement Color Coding for Data Categories
Action: Apply conditional coloring based on data values or categories.
Create a Grade or ColorCorrect node after each shape. Use expressions to drive color based on value thresholds:
value > 0 ? 0.2 : 0.8 # Red channel: low if positive, high if negative
For category-based coloring (e.g., different colors per stock ticker), use a switch or conditional expression referencing a category field in your data.
Maintain brand consistency by defining color variables at project level. Reference these throughout your node tree rather than hardcoding hex values.
Expected result: Bars display different colors based on data conditions. Checkpoint: Verify color logic against 3-4 known data points.
Common failure: Colors appear washed out. Fix by checking colorspace settings (work in linear, output in sRGB) and ensuring Grade node operates in correct space.
Step 8: Create Reusable Node Groups
Action: Package your chart logic into reusable components for future projects.
Select all nodes comprising one chart type. In Nuke, press Ctrl+G to create a Group. In Natron software, use Edit > Group from Selection. In Resolve Fusion, select nodes and choose Macro > Create Macro.
Expose key parameters for easy adjustment:
Data file path
Color scheme (primary, secondary, accent)
Animation duration
Chart dimensions
Save the group/macro to your assets folder with descriptive naming: BarChart_Animated_v1.gizmo
Expected result: Single node that generates complete chart when connected to data. Checkpoint: Duplicate the group, change data source, verify new chart generates correctly.
Node-based systems enable parallel processing and selective recalculation, scaling indefinitely for large projects. Your reusable groups leverage this architecture.
Step 9: Configure Render Settings and Export
Action: Set up output nodes for broadcast-quality delivery.
Create a Write node (Nuke/Natron) or Saver node (Resolve Fusion) connected to your final Merge output.
Configure these settings:
Format: ProRes 422 for editing, H.264 for direct upload
Resolution: Match project settings (1920x1080 minimum)
Frame range: Set explicit start/end frames
File path: Point to your /renders folder with frame padding:
render_####.mov
For Nuke, access render via Render > Write Node. For Natron, use Render > Render All Writers. For Resolve, render from the Deliver page after returning from Fusion.
Expected result: Rendered video file in specified location. Checkpoint: File plays in external player without errors.
Common failure: Render fails at specific frame. Fix by rendering that frame range in isolation to identify the problematic node, then check for expression errors or missing assets at that frame.
Step 10: Optimize for Production Speed
Action: Implement caching and proxy workflows for faster iteration.
Enable disk caching in preferences. In Nuke, set Preferences > Caching > Disk Cache to a fast SSD location. In Natron, configure Edit > Preferences > Caching.
Create proxy nodes for complex sections:
Add a Write node mid-pipeline after intensive calculations
Render this section once
Add a Read node pointing to the rendered output
Use a Switch node to toggle between live calculation and cached proxy
This approach lets you iterate on downstream nodes without recalculating upstream work.
Expected result: Playback and render times decrease significantly after initial cache build. Checkpoint: Compare render time with caching enabled vs. disabled.
Configuration and Customization
Adjust these variables based on your specific requirements:
Animation timing: Default 15-frame transitions work for 30fps delivery. For 60fps output, double to 30 frames. For faster-paced content, reduce to 8-10 frames.
Data scaling: The multiplier in your expressions (e.g., * 0.5) depends on your data range. Calculate as: desired_max_height / max_data_value.
Color values: Define at project level. Finance conventions: green (#22c55e) for positive, red (#ef4444) for negative. Neutral data uses brand colors.
Must-change settings: File paths, data column names, and output resolution. These will break your project if left at defaults.
Safe defaults: Frame rate (30fps), colorspace (sRGB output), and motion blur samples (8) work for most social and web delivery.
Verification and Testing
Execute this verification sequence before final delivery:
Data accuracy check: Export frame 1, frame 50, and final frame. Manually verify displayed values against source CSV at those timestamps.
Animation smoothness: Play back at 1x speed. Flag any frames where motion appears to jump or stutter.
Color consistency: View on calibrated monitor and mobile device. Ensure readability on both.
Audio sync (if applicable): Verify animation beats align with any voiceover or music cues.
Edge cases to verify: Zero values (bars should not disappear or go negative), negative values (should display below baseline or with distinct color), missing data points (should gracefully skip or interpolate).
Success definition: All data points render accurately, animations play smoothly at target frame rate, and output file meets delivery specifications.
Common Errors and Fixes
Error: "Expression error: name 'data' is not defined"
Cause: Data parsing node not connected or not executing before dependent nodes. Fix: Verify node connections flow correctly. In Nuke, ensure Python node has a valid input connection even if unused (connect a Constant node).
Error: "Cannot read file" on render
Cause: Relative paths break when rendering on different machine or render farm. Fix: Use absolute paths or environment variables. In Nuke: [getenv PROJECT_ROOT]/data/file.csv
Error: Black frames in output
Cause: Alpha channel issues or incorrect Merge operations. Fix: Add a Premult node before final output, or check Merge node is set to "Over" operation with correct A/B input order.
Error: Render takes hours for 30-second clip
Cause: Unoptimized node tree recalculating everything per frame. Fix: Implement caching (Step 10), reduce motion blur samples, or pre-render static elements separately.
Error: "Out of memory" crash
Cause: Too many high-resolution nodes active simultaneously. Fix: Reduce viewer proxy resolution during work, close unused viewers, and increase system virtual memory allocation.
Error: Fonts missing on different machine
Cause: System fonts not installed on render machine. Fix: Include font files in project folder and reference by path, or convert text to geometry before rendering.
Next Steps and Extensions
With your foundational workflow established, expand your capabilities:
Add chart types: Duplicate your bar chart group and modify for line charts (use Bezier or RotoPaint nodes with expression-driven points) and pie charts (use Radial nodes with animated sweep angles).
Integrate 3D elements:Houdini embraced node-based proceduralism decades ago, and you can import Houdini geometry caches or use built-in 3D systems in Nuke and Fusion for dimensional charts.
Automate with scripting: Build Python scripts that generate entire node trees from data files, eliminating manual setup for recurring reports.
For creators seeking faster iteration without deep technical setup, Flowi automates data-driven animation with AI, generating After Effects-quality charts directly from datasets. This complements node-based skills by handling rapid production while you reserve compositing tools for complex custom work.
Frequently Asked Questions
What are some alternatives to After Effects for data visualization?
Node-based compositing tools offer powerful alternatives. Nuke VFX software provides industry-standard compositing with deep expression support. Natron software delivers similar capabilities as a free, open-source option. DaVinci Resolve includes Fusion for compositing within a complete editing suite. Blackmagic Fusion standalone offers professional features without subscription costs. Each excels at data-driven animation through expression linking and procedural workflows.
Why should I consider node-based compositing over layer-based systems?
Node-based systems visualize your entire workflow as a connected graph. You modify any node without affecting others, enabling non-destructive editing. Complex projects with dozens of data sources remain manageable because relationships are explicit. Performance scales better for large projects since only changed nodes recalculate. The initial learning investment pays off through faster revisions and reusable components.
How does Blackmagic Fusion compare to After Effects?
Fusion uses a node-based architecture versus After Effects' layer-based approach. Fusion handles complex compositing more efficiently for projects with many elements. After Effects offers more motion graphics presets and a larger plugin ecosystem. Fusion integrates directly with DaVinci Resolve for seamless color and edit workflows. For data visualization specifically, Fusion's expression system and 3D workspace provide advantages for technical animations.
When is it best to use Natron instead of After Effects?
Choose Natron software when budget constraints matter, as it is completely free and open-source. Natron works well for teams needing cross-platform consistency (Linux, Mac, Windows). Projects requiring custom node development benefit from Natron's Python-based extensibility. However, After Effects remains preferable when you need specific third-party plugins or templates that only exist in the Adobe ecosystem.
Which tools are best for beginners transitioning from After Effects?
DaVinci Resolve Fusion provides the gentlest transition because it includes familiar editing tools alongside node-based compositing. The free version offers nearly all features needed for data visualization. Natron software closely mirrors Nuke's interface at no cost, making it ideal for learning industry-standard workflows. Start with simple projects: connect a background, add shapes, then gradually introduce expressions and data linking.
What are the advantages of using Blender for motion graphics?
Blender combines 3D modeling, animation, and compositing in one free application. Its geometry nodes system enables procedural animation driven by data. The integrated compositor uses a node-based workflow similar to dedicated compositing tools. Blender excels when your data visualization requires 3D elements, camera animation, or physics simulations. The active community provides extensive tutorials and add-ons for financial and data visualization specifically.
Sources
Read Next
Continue Exploring

Dynamic Models vs. Traditional Charts: Which Wins?
Compare dynamic models vs. traditional charts for financial content. See which visualization method drives higher viewer engagement and fits your workflow.
5 Benefits of Multi-Image Fusion for Financial Narratives
Learn 5 ways multi-image fusion elevates financial narratives with better visual fidelity, faster turnaround, and stronger investor engagement.

7 Elements That Make Financial Animations Trustworthy
Discover the key elements of high-fidelity animation that build audience trust in financial content. Essential guide for creators who prioritize accuracy.