The uncomfortable truth about finance presentations that look stunning but say nothing meaningful
Learn why beautiful visualizations without solid data analysis techniques actually mislead decision-makers. This POV challenges the 'make it visual' default and shows what rigorous data interpretation really requires.
TL;DR
Visuals without analysis mislead - Pretty charts built on weak data interpretation create content that looks professional but fails to inform decisions.
The workflow is backwards - Most creators start with design and work toward data; effective storytelling starts with rigorous analysis and ends with visualization.
Analysis is architecture - Data interpretation is the foundation; visualization is translation. Spend 70% of time understanding before illustrating.
Credibility compounds - Finance audiences trust creators who demonstrate analytical rigor, not just design polish.
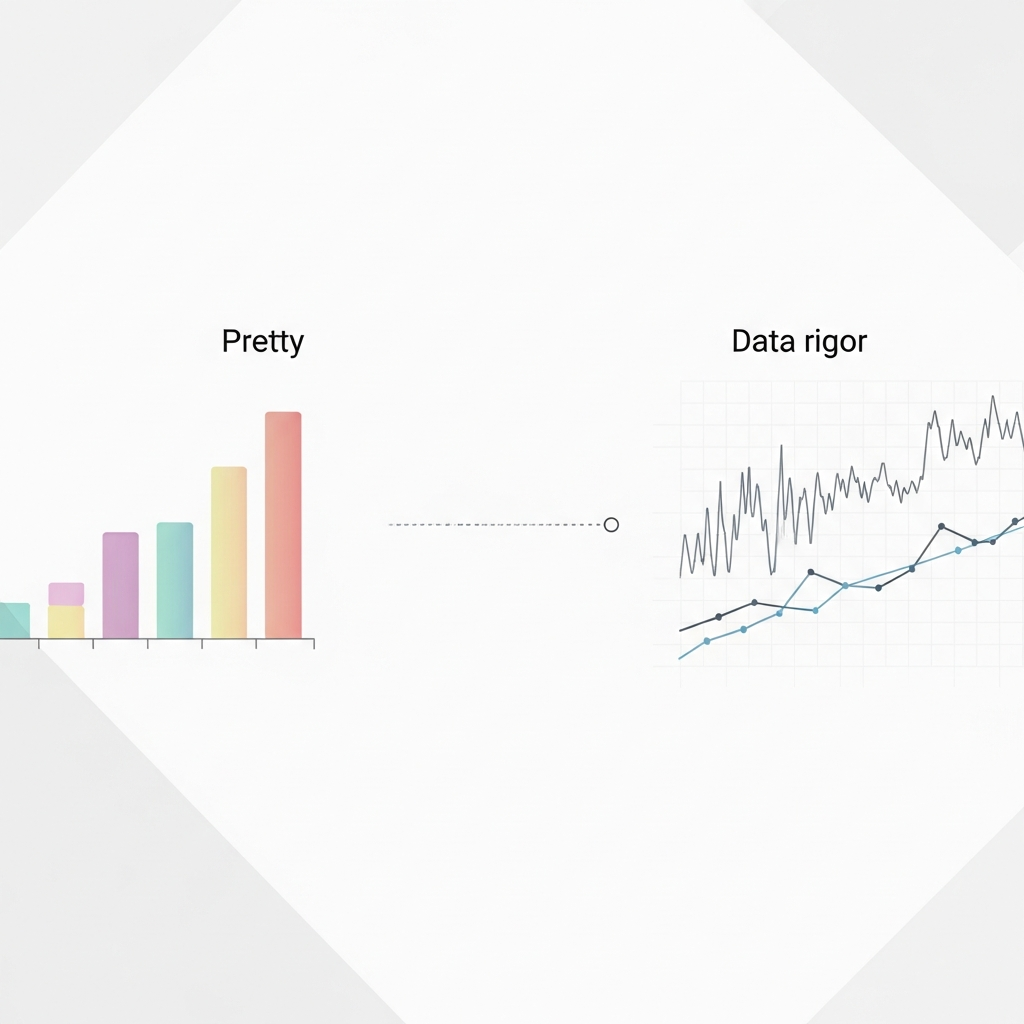
The Prettiest Chart in the Room Is Often the Emptiest
I've watched finance teams spend weeks perfecting gradient colors and animation timing on charts that said absolutely nothing. The visuals were stunning. The data interpretation was nonexistent. And when the presentation ended, nobody could remember what the numbers actually meant.
This is the uncomfortable truth about visual storytelling in finance: we've become obsessed with the wrapper while ignoring what's inside. The result is a generation of beautiful, forgettable content that fails to move decisions or change minds.
Why "Make It Visual" Became the Default Answer
The advice makes sense on the surface. Visual storytelling improves audience retention by 68% compared to text alone. Executives are busy. Attention spans are shrinking. Of course we should visualize our data.
So the playbook emerged: take your spreadsheet, drop it into a charting tool, add some motion graphics, and call it a day. The logic felt sound. Visuals are engaging. Engagement equals impact. Case closed.
Except it's not working. Despite more visualization tools than ever, 66% of marketing and sales professionals still feel anxious working with data. The tools got better. The understanding didn't.
Here's What I Actually Believe
Visual storytelling without rigorous data analysis techniques is just decoration. Pretty charts with weak foundations don't inform; they mislead. And in finance, where decisions carry real consequences, decoration is dangerous.
The Analysis Gap Nobody Talks About
I've reviewed hundreds of data presentations over the past few years. The pattern is consistent: creators jump straight from raw data to visual output, skipping the interpretive work that makes visualization meaningful.
Consider a common scenario. A finance influencer wants to show why a particular stock outperformed its sector. They pull the price data, create a sleek animated line chart, add some branded colors, and publish. The visual is professional. But what's the actual story?
Without proper data analysis techniques, that chart could be misleading in a dozen ways. Maybe the timeframe was cherry-picked. Maybe the comparison ignores dividends or splits. Maybe the "outperformance" disappears when adjusted for volatility. The visual doesn't lie, exactly. It just doesn't tell the truth either.
Organizations using data visualization with storylines improve decision-making accuracy by 28%. The key phrase is "with storylines." The visualization is the delivery mechanism. The storyline, built on sound analysis, is what actually drives better decisions.
This is why 71% of executives consider good data storytelling skills crucial, yet only 21% of marketers rank data visualization for storytelling as a high priority. There's a disconnect between what leaders need and what creators are producing. The gap isn't in tools or design skills. It's in analytical rigor.
What Changes If This Is True
If visual storytelling depends on analytical foundations, then the current workflow is backwards. Most creators start with "what will look good?" and work toward data. The question should be "what does this data actually say?" with visualization as the final translation step.
This has real implications for how finance content gets made. It means spending more time with the numbers before opening any design tool. It means questioning assumptions, testing alternative interpretations, and being honest about limitations. It means accepting that some data doesn't deserve a fancy chart.
For finance communicators, this is the difference between content that gets shared and content that gets trusted. Retention of data jumps from roughly 5-10% to 67% when paired with genuine storytelling. But that storytelling has to be earned through understanding, not manufactured through motion graphics.
A Better Mental Model: Analysis as Foundation, Visuals as Translation
Think of data interpretation as architecture and visualization as interior design. You can have the most beautiful interiors in the world, but if the structure is unsound, the building falls down.
The best finance communicators I know spend 70% of their time on analysis and 30% on presentation. They interrogate their data before illustrating it. They can explain their conclusions in plain language before adding a single animation. The visuals become powerful because they're translating something real.
When data is visually compelling and analytically sound, 88% of professionals feel confident presenting it. That confidence comes from knowing the foundation is solid, not from hoping the graphics distract from weak reasoning.
The Standard Worth Holding
Data analysis techniques aren't optional prerequisites for visual storytelling. They're the substance that makes visualization worth doing. Every animated chart, every motion graphic, every polished presentation should answer one question first: what does this data actually mean?
The finance creators who understand this will build audiences that trust them. The ones who don't will keep producing content that looks impressive and says nothing. In an industry built on credibility, that's not a distinction you can afford to ignore.
Frequently Asked Questions
What is data storytelling?
Data storytelling combines rigorous analysis with narrative structure and visualization to communicate insights that drive decisions. It's the practice of translating what numbers mean into terms audiences can understand and act upon.
Why is data storytelling important?
Data alone doesn't move people to action. When analysis is paired with narrative context and clear visuals, comprehension and retention increase dramatically, making insights actionable rather than forgettable.
Which visualizations are best for data storytelling?
The best visualization is whichever one most clearly communicates your specific insight. Start with what the data says, then choose the format that translates that meaning most effectively for your audience.
Sources
Read Next
Continue Exploring

Dynamic Models vs. Traditional Charts: Which Wins?
Compare dynamic models vs. traditional charts for financial content. See which visualization method drives higher viewer engagement and fits your workflow.

How to Boost Engagement with Interactive Data Visualization
Learn how interactive data visualization helps finance creators boost audience engagement. Practical frameworks for visual storytelling and workflow automation.

How to Cut Finance Video Production Time by 50%
Cut finance video production time by 50% with visual storytelling techniques. Build automated workflows that replace manual charting and boost audience growth.